
Month-end pressure exposes every fragile seam in accounts payable. Endless keying, back-and-forth approvals, and status-chasing drain energy, while last-minute exceptions crowd calendars with repetitive tasks. The outcome is predictable: stressed teams, stalled projects, and missed opportunities to support pricing, cash, and supplier strategies. Treating this as a tooling issue misses the point. A healthier AP operation is an environment design improvement, providing clear rules, clean data, and automation that carries the routine so people focus on analysis and decisions.
A workable sequence helps. First, codify how invoices should flow – what qualifies for PO coverage, the variance bands that trigger exceptions, and who owns which approvals. Second, align master data so supplier records, rate cards, and tax/banking fields reconcile with the ledger. Only then does the technology layer lock in the behavior. In many programs, teams formalize those standards before any rollout, and accounts payable software becomes the enforcement layer that keeps the rules observable and auditable across cycles.
Why Manual AP Erodes Morale and Capacity
Manual AP inflates cognitive load. Constant data entry, duplicate checks, and exception rework produce attention residue that lingers long after a ticket closes. Queueing delays are equally corrosive; scattered documents and “just following up” emails turn simple approvals into multi-day threads. Visibility gaps keep everyone on edge when invoice status hides across inboxes and file shares, the fastest path is another message, which interrupts focused work for AP and requesters alike. Over time, these frictions signal career stagnation: hours spent keying invoices displace analysis, partnering with category leaders, or contributing to forecasts.
The macro context makes this more urgent. Gallup estimates low employee engagement costs the global economy $8.9 trillion, which about 9% of global GDP, and finds engagement stagnating worldwide, with clear implications for productivity and well-being. Payments risk pressures morale too. The Association for Financial Professionals reports 79% of organizations encountered attempted or actual payments-fraud activity in 2024, which adds investigation work, escalations, and after-hours effort unless controls are embedded in the flow.
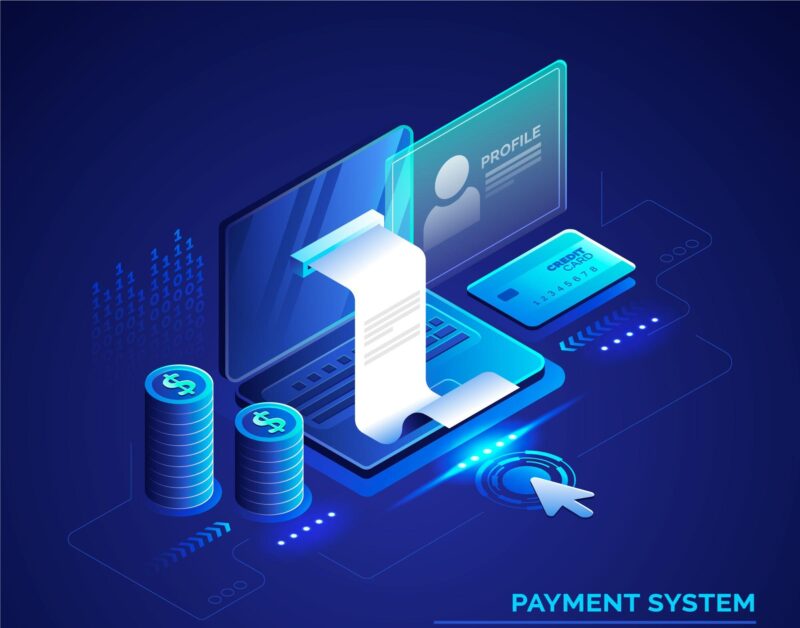
What Changes with AP Automation
Touchless capture and coding remove most low-value keystrokes. Modern extraction maps headers and lines to GL and cost centers, drafts invoices automatically, and routes exceptions by root cause (price variance, quantity variance, missing receipt). Policy moves from PDF to pathway: “no-PO-no-pay” rules, calibrated two-/three-/four-way matching, and approval matrices ride with each document. Vendor-data changes stop living in email; dual control, verified callbacks, and tamper-evident logs make bank edits safe without slowing payments unnecessarily. Mobile, in-context approvals compress wait time, so cycle-time spikes don’t cascade into late fees or discount loss. Together, these shifts reduce after-hours spikes at close, lower context-switching, and create time for higher-order work.
Time Reallocated
When exceptions shrink and approvals flow, attention shifts to outcomes that staff actually want to own. Working-capital design replaces ad-hoc payment timing: discount programs become intentional, days-payable-outstanding (DPO) tuning is scenario-driven, and payment-run cadence aligns to liquidity planning. Spend and variance analytics become part of the weekly rhythm, including price realization by SKU or service, exception recurrence trendlines, and category leakage inform sourcing plays and budget pacing. Supplier performance conversations improve because the conversation is anchored in evidence (OTIF, lead-time variance, dispute cycle-time). Risk and compliance posture strengthens as a byproduct: duplicate attempts blocked and SoD verification rates move from anecdotes to KPIs, and audit evidence packs are one click away instead of an inbox search.
Operating Model and Roles
Role Evolution After AP Automation
| Role | Before (manual-heavy) | After (automation-enabled) | Satisfaction & strategic uplift |
| AP Specialist | Keying data; chasing approvals; manual match | Exception triage by root cause; vendor-master hygiene; SLA stewardship | Clear ownership; fewer interrupts; visible impact on KPIs |
| AP Manager | Firefighting at month-end; spreadsheet reporting | KPI ownership; tolerance tuning; control testing; cadence leadership | Predictable close; mastery path into governance/analytics |
| Treasury Analyst | Reactive payment timing | Terms modeling; discount capture; liquidity scenarios | Direct business outcomes; higher autonomy |
| Procurement Analyst | Ad-hoc price checks | Contract-to-invoice realization analytics; leakage detection | Evidence-led sourcing plays; stronger stakeholder credibility |
| Controller / FP&A | Late accrual fixes; status chasing | Forecast quality control; exception insights; scenario planning | Cleaner forecasts; fewer surprises; better business partnering |
Design decisions make these role shifts durable. Exception taxonomies should route to the smallest group capable of resolution, with auto-notifications and SLA clocks to reduce “ticket pinball.” Category-specific tolerances curb alert fatigue while catching genuine anomalies. Also, contract IDs must map to SKUs/services in the ERP so price-realization math is automatic.
How to Measure the Uplift and Keep It
Measurement needs to be compact and stable so teams can see trend lines without gaming the system.
Efficiency And Control Core KPIs
Track first-pass match rate, touchless posting percentage, requisition-to-PO and receipt-to-post cycle times, and duplicate attempts blocked.

Rising first-pass match and touchless rates indicate better design and cleaner masters; shorter cycle times show approvals and receiving are in sync; duplicate blocks quantify risk avoided.
Engagement And Experience Indicators
Monitor AP ticket backlog age, after-hours spikes during close, approval turnaround, and an internal NPS for requesters and approvers. These act as sentiment thermometers, catching friction before it turns into attrition.
Adoption Mechanics
Make master-data stewardship explicit (named owners, change windows), keep mandatory intake fields tight, and run a monthly KPI review with exception deep-dives by root cause. Quarterly control tests (sampled bank-change callbacks, payment-file signatures, positive-pay rejects) maintain trust with internal audit and treasury.
Case Example
Nordson, a global precision-technology manufacturer, replaced manual capture and ad-hoc matching with an automated AP flow anchored in standard intake fields, mapped contract IDs, and calibrated tolerance bands. After rollout, average invoice processing time dropped to 4 days, on-time payment reached 62%, and the first-pass match rate climbed to 89%. That’s a shift that cut end-of-month firefighting and gave analysts space for terms modeling and discount design.
Why AP Automation Improves Satisfaction
People want to see progress in their span of control. When a specialist owns an exception queue with clear SLAs, and the tooling shows which root cause dominates this week, effort translates into visible improvement. When a manager tunes tolerances and immediately sees forced-matches drop, mastery replaces firefighting. And when analysts discuss price-realization gaps with category leaders using shared dashboards rather than ad-hoc spreadsheets, the conversation shifts from blame to design. The broader engagement picture matters here: global stagnation in employee engagement underscores how role clarity, better tools, and achievable goals help teams regain momentum.